eBPF Real-time Network Monitoring
Building a highly scalable real-time network monitoring system with eBPF & XDP that achieves 7x performance improvement over traditional tools
Project Overview
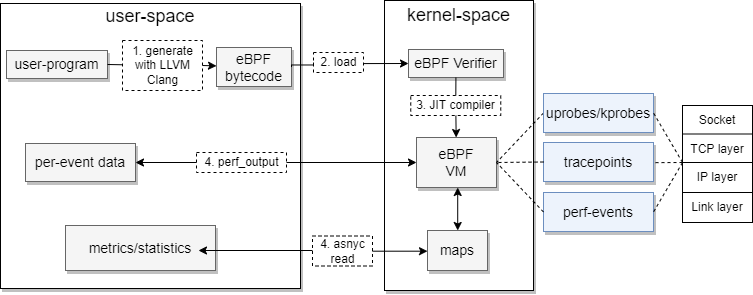
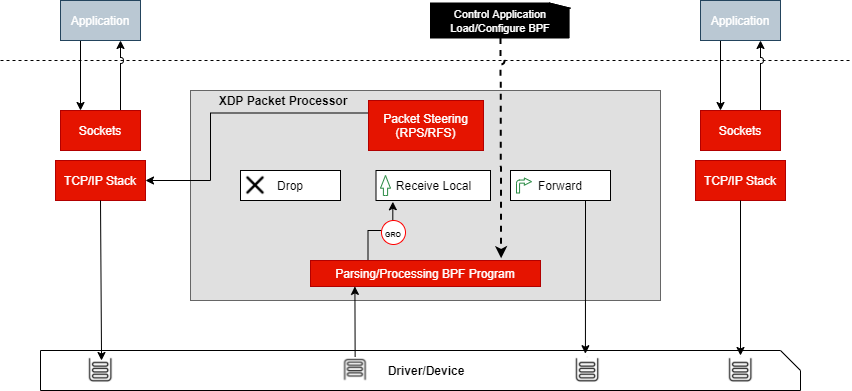
eBPF architecture bridging user and kernel space for high-performance network monitoring
This project addresses the growing challenges in network monitoring for Industry 4.0 and cloud-native applications. As network traffic increases, traditional monitoring solutions struggle with scalability, real-time capabilities, and resource efficiency.
Our solution leverages eBPF (extended Berkeley Packet Filter) and XDP (eXpress Data Path) to create a high-performance monitoring system that operates at the kernel level, providing unprecedented visibility into network behavior with minimal overhead.
System Design Overview
Four-layer monitoring system architecture: Collection, Reporting, Management, and Presentation
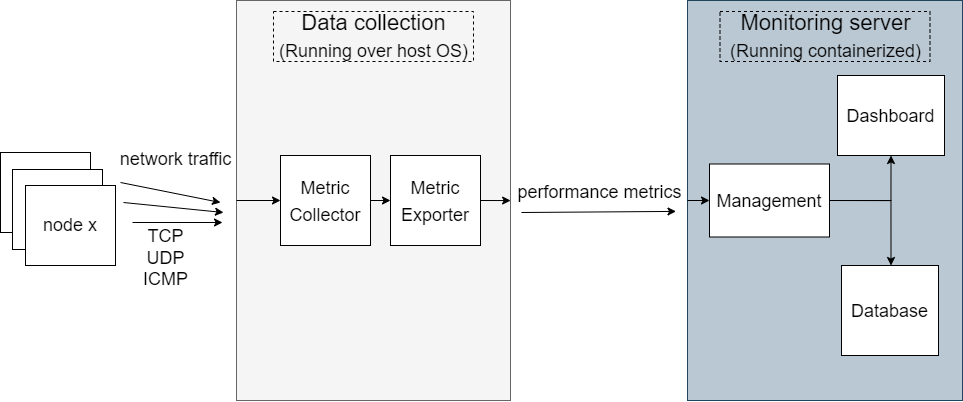
Our monitoring system follows a four-layer abstract architecture based on industry best practices. The collection layer gathers measurements from network events and preprocesses them. The reporting layer exports measurement data for consumption by administrative entities. The management layer handles data storage and integrity checking. The presentation layer provides visual representation for easier network monitoring.
Complete data flow from collection to visualization showing component interactions
Technical Implementation
DataAggregator Module
- • MetricCollector: eBPF programs for kernel-level tracing
- • PacketSampler: Active probing for comprehensive coverage
- • XDP-packetDrop: High-performance packet filtering
- • DataExporter: Prometheus-compatible metrics export
DataVisualizer Module
- • MonitoringServer: Prometheus-based metrics storage
- • Visualization: Grafana dashboards
- • Database: Time-series data persistence
- • MetricsExporter: Third-party integration
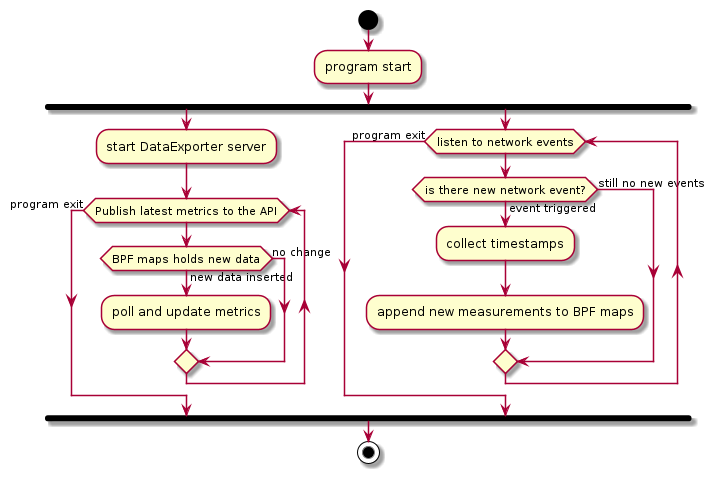
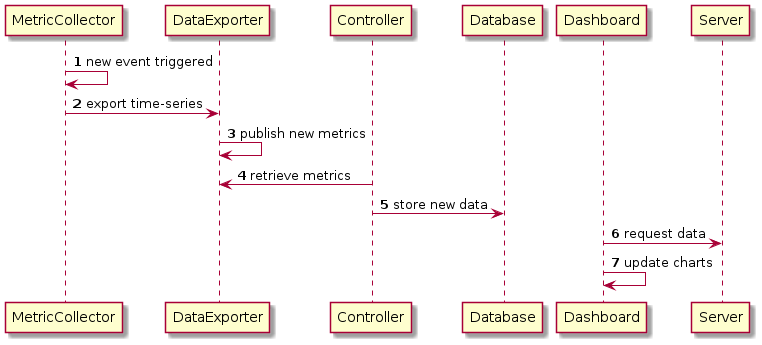
eBPF packet filtering and data exporting workflow showing parallel processing
XDP Technology Deep Dive
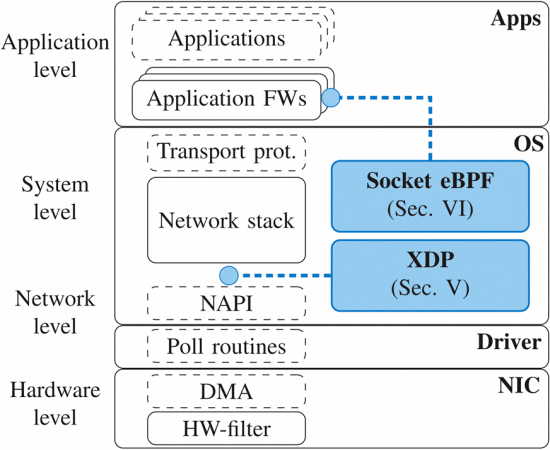
XDP packet processing at the lowest layer of Linux network stack
XDP (eXpress Data Path) is a fast programmable packet processing framework operating at the kernel level. It represents the lowest layer of the Linux network stack, allowing the installation of programs that process packets directly in the kernel. These programs execute for every incoming packet, providing unprecedented performance for network monitoring and filtering operations.
By bypassing traditional network stack overhead, XDP enables our monitoring system to achieve significant performance improvements while maintaining compatibility with existing network infrastructure.
Advanced Packet Filtering
Four levels of packet filtering from hardware to application layer
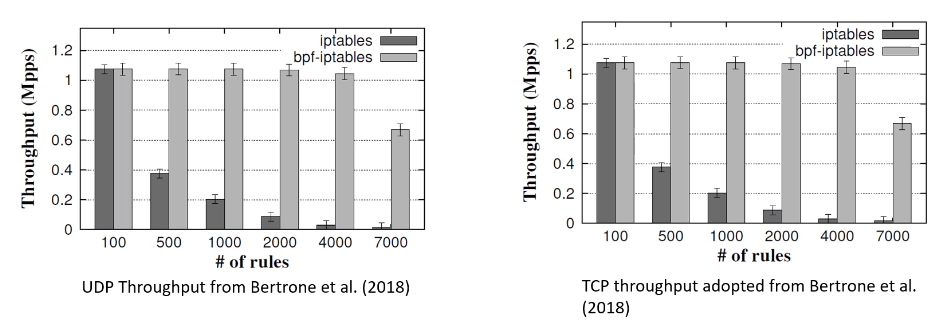
eBPF packet filtering performance compared to traditional IPTables
Packet Filtering Layers
1. Hardware Layer
Network interface card (NIC) level filtering - most efficient but limited functionality
2. Network Layer
Operating system network stack filtering - more flexible than hardware
3. System Layer
Firewall-based filtering - higher flexibility with moderate efficiency
4. Application Layer
Application-level filtering - maximum flexibility but lowest efficiency
Performance Evaluation
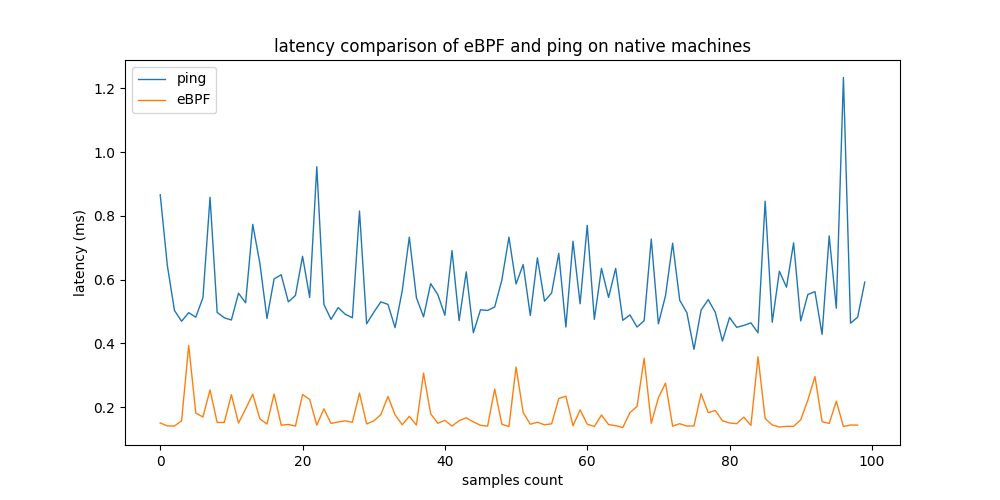
Latency Comparison - Native Linux
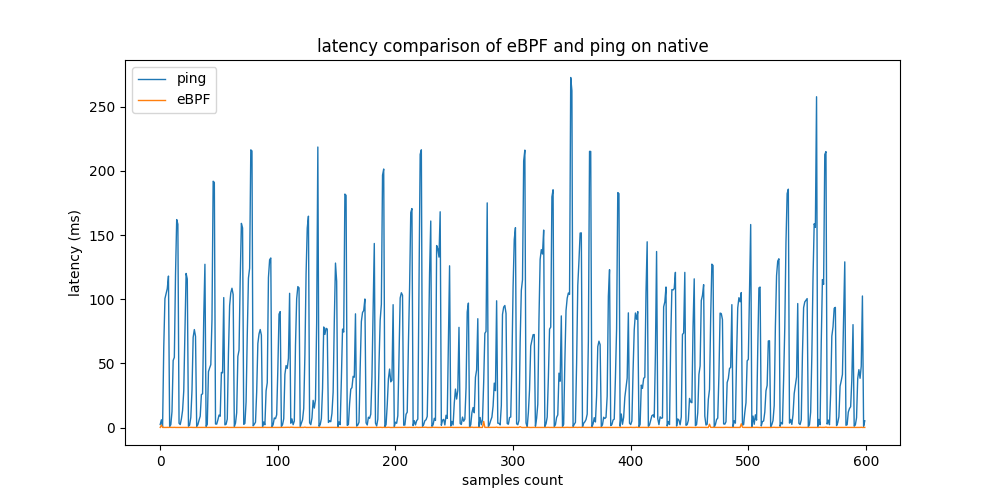
eBPF vs. traditional ping latency measurements on native Linux
Latency Comparison - GCP
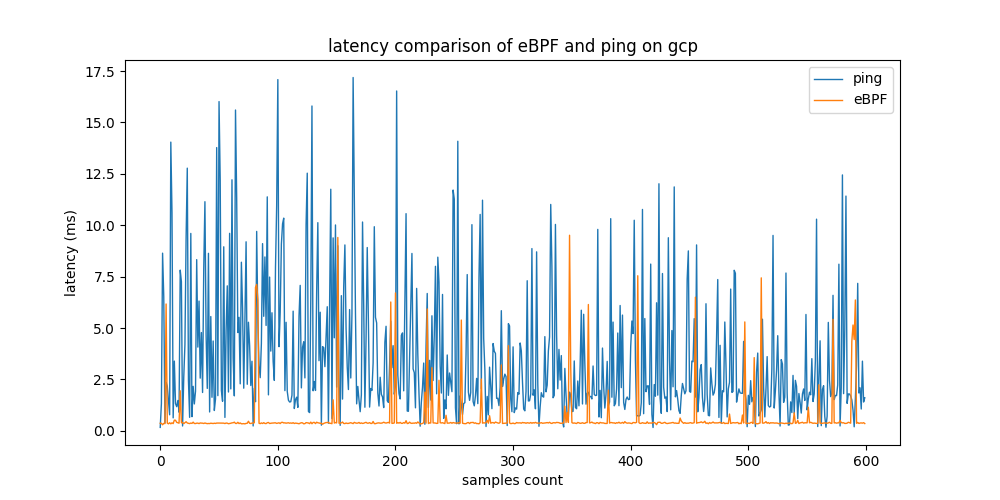
Performance comparison on Google Cloud Platform infrastructure
Extended Performance Analysis
Latency Comparison - Docker
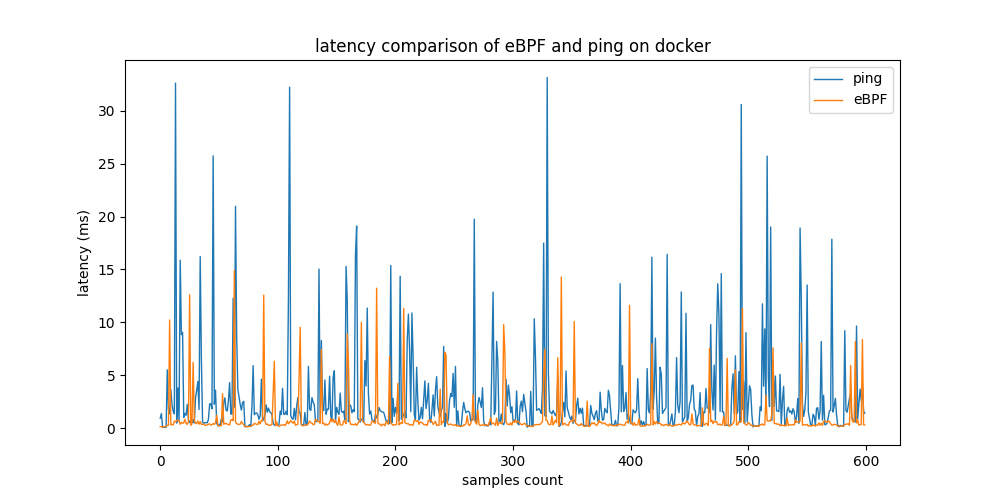
Performance evaluation in containerized environments
Single Node Evaluation
Robustness and accuracy evaluation on single node testbed
Comprehensive Stress-Test Results
| Testbed | Tool | Avg Latency (ms) | Std Deviation (ms) |
|---|---|---|---|
| GCP | eBPF MetricCollector | 0.634 | ±1.15 |
| GCP | ping | 3.577 | ±3.258 |
| Docker | eBPF MetricCollector | 0.747 | ±1.851 |
| Docker | ping | 3.054 | ±5.553 |
| Native | eBPF MetricCollector | 0.193 | ±0.262 |
| Native | ping | 51.134 | ±56.990 |
Results show consistent 7x performance improvement across all environments, with the most dramatic difference on native hardware where ping varies greatly while eBPF remains stable.
Real-time Monitoring Dashboards
Prometheus Monitoring Server
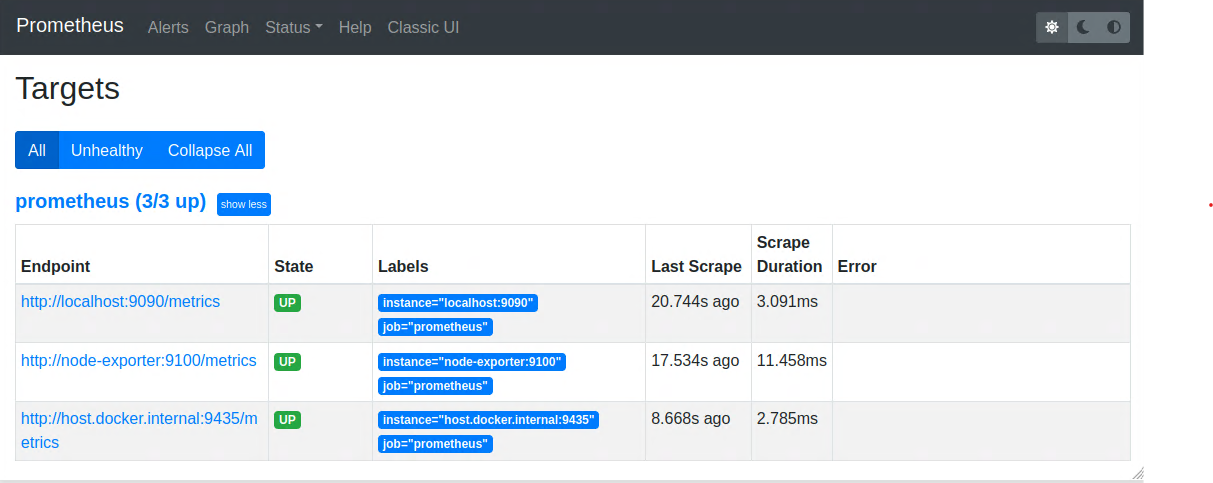
Prometheus dashboard showing all connected metrics resources and exporters
Prometheus Integration
The DataExporter component publishes up-to-date network metrics in Prometheus format, enabling external services to scrape them asynchronously. This integration provides a robust foundation for metrics collection with a large ecosystem of exporters and client libraries available in multiple programming languages.
# Example Prometheus metrics output
metric_latency{destination_ip="192.168.1.10", source_ip="192.168.1.1"} 0.179
metric_throughput{destination_ip="192.168.1.10", source_ip="192.168.1.1"} 1024.5
metric_connections_total 397
Grafana Visualization Dashboard
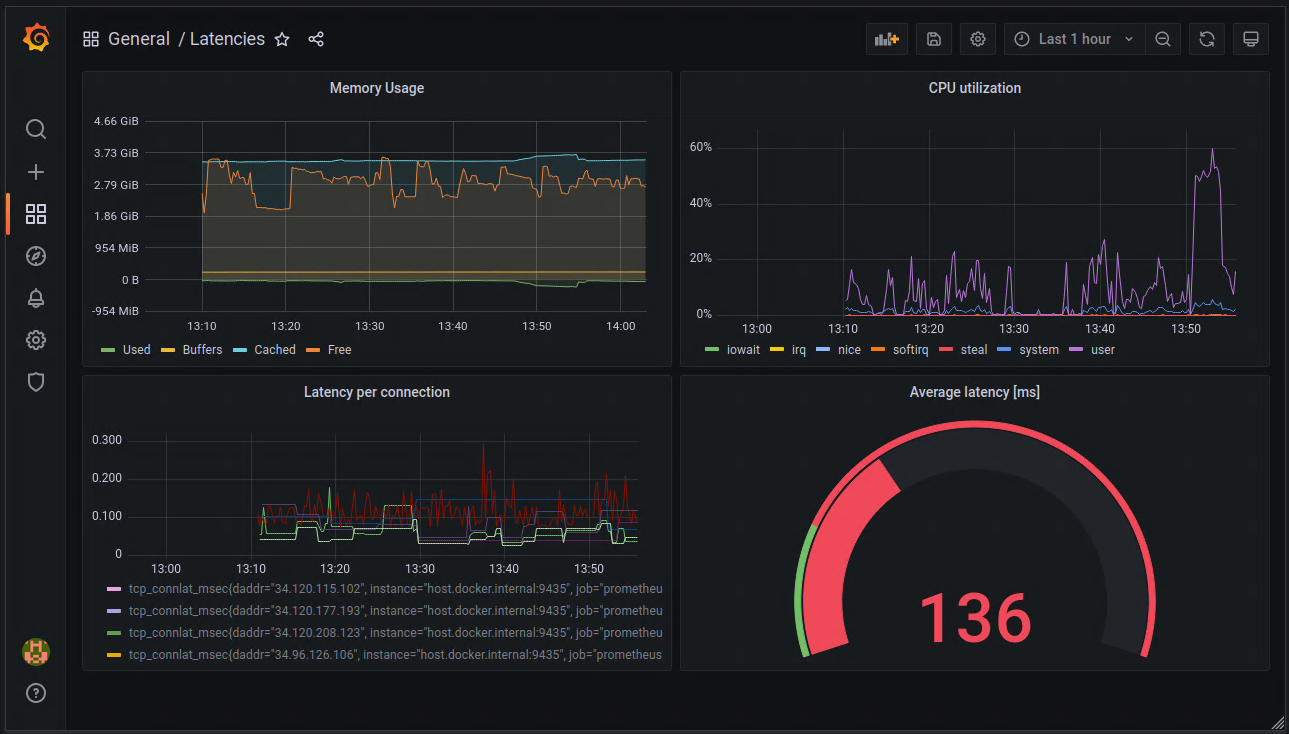
Grafana dashboard displaying real-time network metrics with interactive charts and alerts
Dashboard Features
- • Real-time Charts: Live network performance visualization
- • Custom Alerts: Configurable thresholds and notifications
- • Historical Data: Time-series analysis and trending
- • Multi-Environment: Support for various deployment scenarios
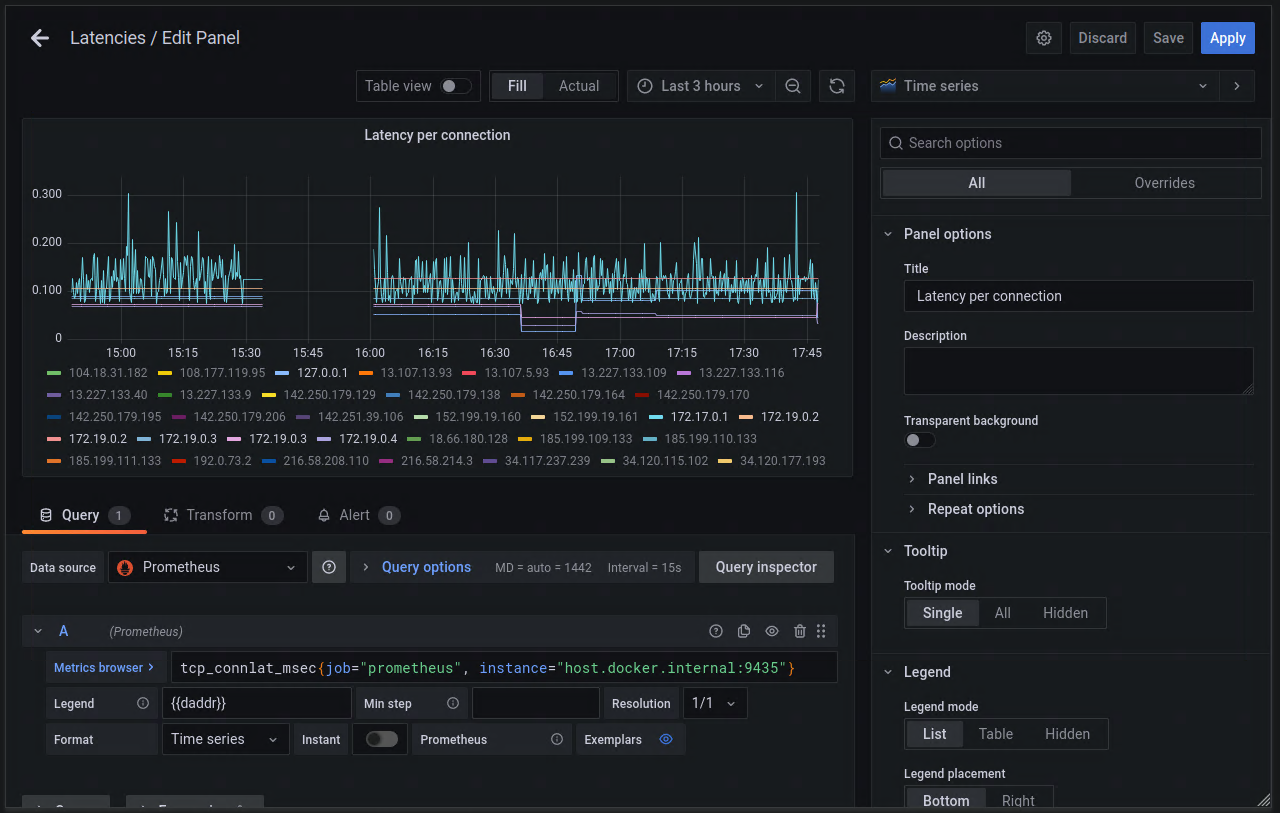
Easy panel creation interface for custom metric visualization
Resource Utilization Analysis
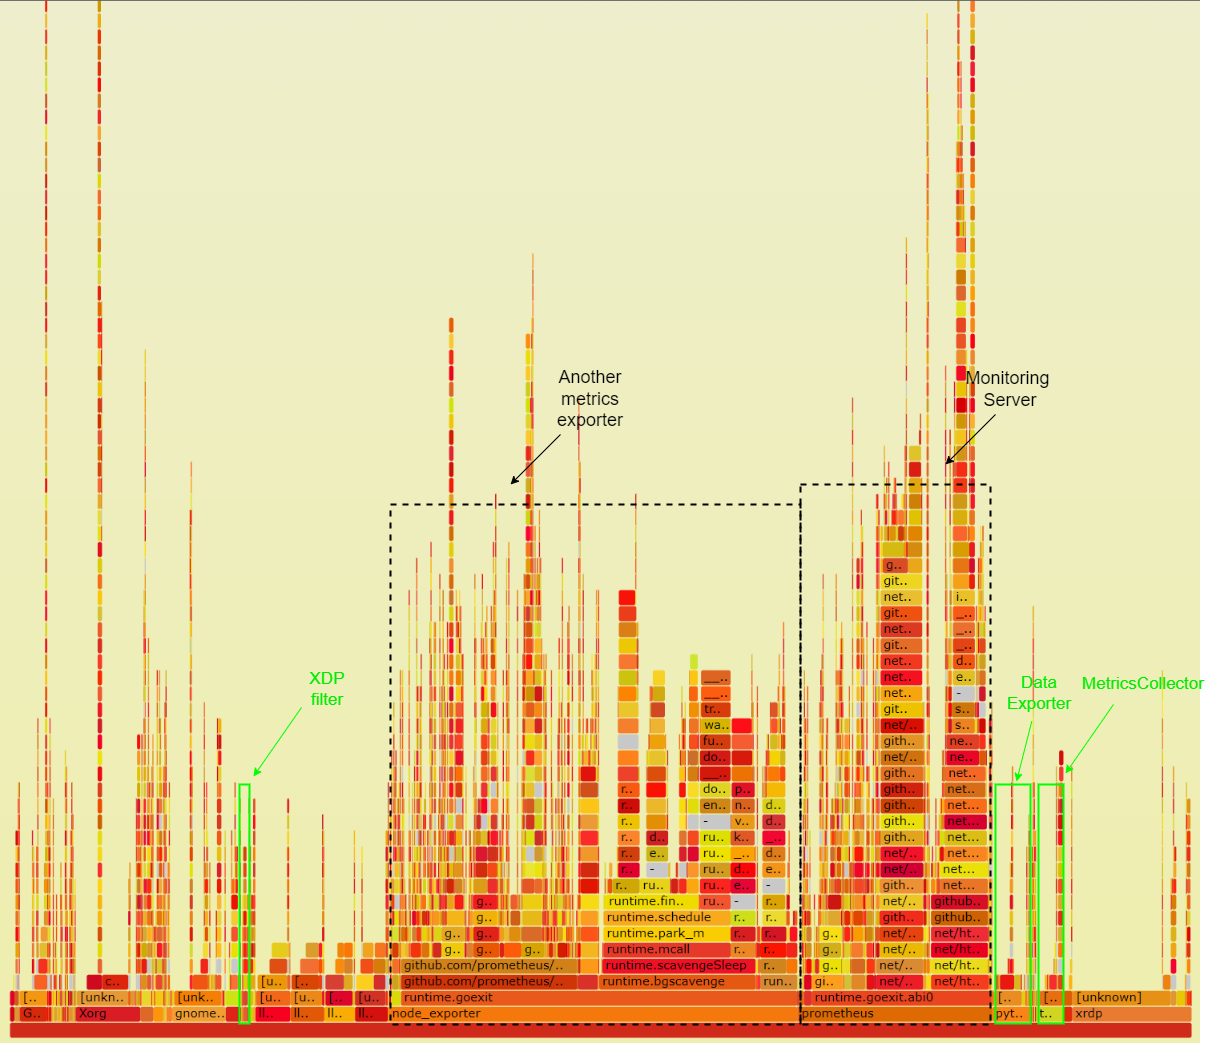
Flamegraph analysis showing CPU utilization distribution across system components
Hardware Utilization Results
Our comprehensive CPU utilization analysis reveals significant efficiency gains. The eBPF-based MetricsExporter and MetricCollector together consume only 5.56% CPU, compared to 34.57% for node_exporter- representing a 7x improvement in resource efficiency.
Implementation Insights
Key Technical Achievements
Kernel-Level Monitoring
eBPF programs inject tracing points directly in the Linux kernel, capturing network events with minimal overhead and maximum accuracy.
Active Probing
PacketSampler ensures comprehensive coverage by generating probe packets when traffic is low, maintaining real-time monitoring capabilities.
XDP Packet Dropping
High-performance packet filtering reduces bandwidth consumption and CPU context switches by processing packets at the lowest network stack level.
Scalable Architecture
Containerized design with Docker-compose enables flexible deployment across various environments from single nodes to cloud platforms.
BCC Framework Integration
The implementation utilizes BCC (BPF Compiler Collection) to simplify eBPF program development. BCC provides a Python interface for writing eBPF programs, eliminating the need for deep kernel programming knowledge while maintaining performance benefits.
# Example BCC Python integration
from bcc import BPF

# Define eBPF program
bpf_program = """
int trace_tcp_connect(struct pt_regs *ctx) {
    // Kernel-level network tracing
    return 0;
}
"""

# Load and attach to kernel
b = BPF(text=bpf_program)
b.attach_kprobe(event="tcp_connect", fn_name="trace_tcp_connect")- 7x faster latency measurements than traditional ping
- 5x reduction in CPU utilization compared to conventional tools
- Real-time network monitoring at kernel level
- Scalable architecture supporting multiple deployment environments